棒グラフの描画
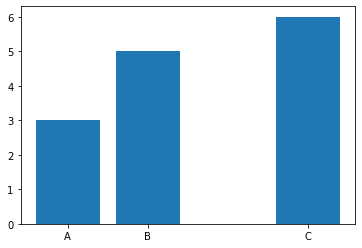
基本的な描画
barメソッドで棒グラフを描画することができます。
第1引数に棒の横軸位置、第2引数に棒の高さを設定します。
tick_label引数に文字列を指定すると、横軸に表示されるラベルとして設定できます。
IN
import matplotlib.pyplot as plt
x = [1, 2, 4]
y = [3, 5, 6]
labels = ['A', 'B', 'C']
plt.bar(x, y, tick_label=labels)
plt.show()
OUT
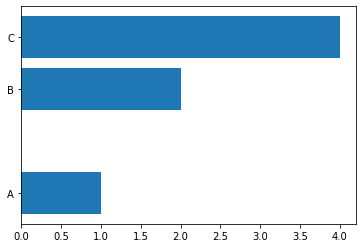
横向き棒グラフ
barhメソッドだと、横向きで棒グラフを作成できます。
IN
import matplotlib.pyplot as plt
x = [1, 2, 4]
y = [3, 5, 6]
labels = ['A', 'B', 'C']
plt.barh(y, x, tick_label=labels)
plt.show()
OUT
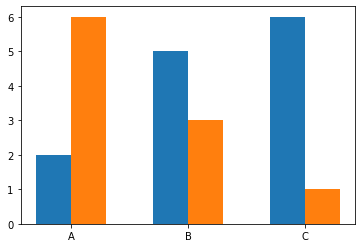
複数棒のグラフ
x軸の座標をずらし、ずらした分でwidth引数で棒幅を設定することで複数に並べて棒グラフを描画できる。
IN
import matplotlib.pyplot as plt
x1 = [1, 2, 3]
x2 = [1.3, 2.3, 3.3]
y1 = [2, 5, 6]
y2 = [6, 3, 1]
labels = ['A', 'B', 'C']
plt.bar(x1, y1, width=0.3, align="center")
plt.bar(x2, y2, width=0.3)
plt.xticks([1.15, 2.15, 3.15], labels)

plt.show()
OUT